ReliabilityFirst Long-term Reliability Assessment highlights resource adequacy risk in MISO, PJM over next 10 years
 By Tim Fryfogle, Principal Engineer – Resources, Engineering and System Performance
ReliabilityFirst conducts an annual Long-term Reliability Assessment to ensure that its footprint has adequate resources to serve anticipated load demand for the next 10-year period. This analysis was conducted using data from 2024.
Over the next 10 years, both the MISO and PJM assessment areas within the ReliabilityFirst (RF) footprint project to be at risk of not having enough generation capacity to meet customer demand.
Within the MISO area, this reliability risk is particularly high, beginning this year (2025), with projections increasing further over the next 10 years.
Within the PJM area, the reliability risk starts around 2029, with projections increasing over the following five years.
This analysis is based on data provided by MISO and PJM, which RF uses to conduct our annual Long-term Reliability Assessment (LTRA) to ensure that our footprint has adequate resources to serve anticipated load demand for the next 10 years.
Each assessment area within RF (i.e., MISO and PJM) has a targeted reserve margin level, which identifies the minimum amount of electricity generation resources needed in a projected scenario, called a “loss of load expectation.” This is a scenario that is estimated to occur one day within a 10-year period, which is considered the industry standard baseline for this type of resource adequacy planning.
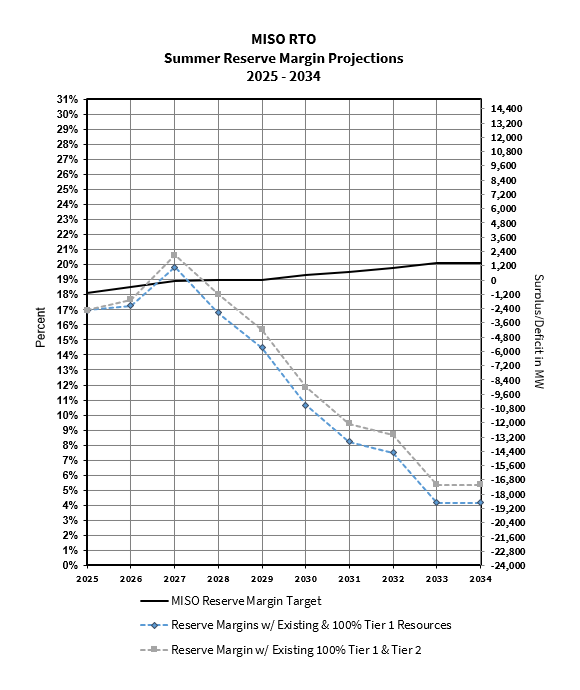
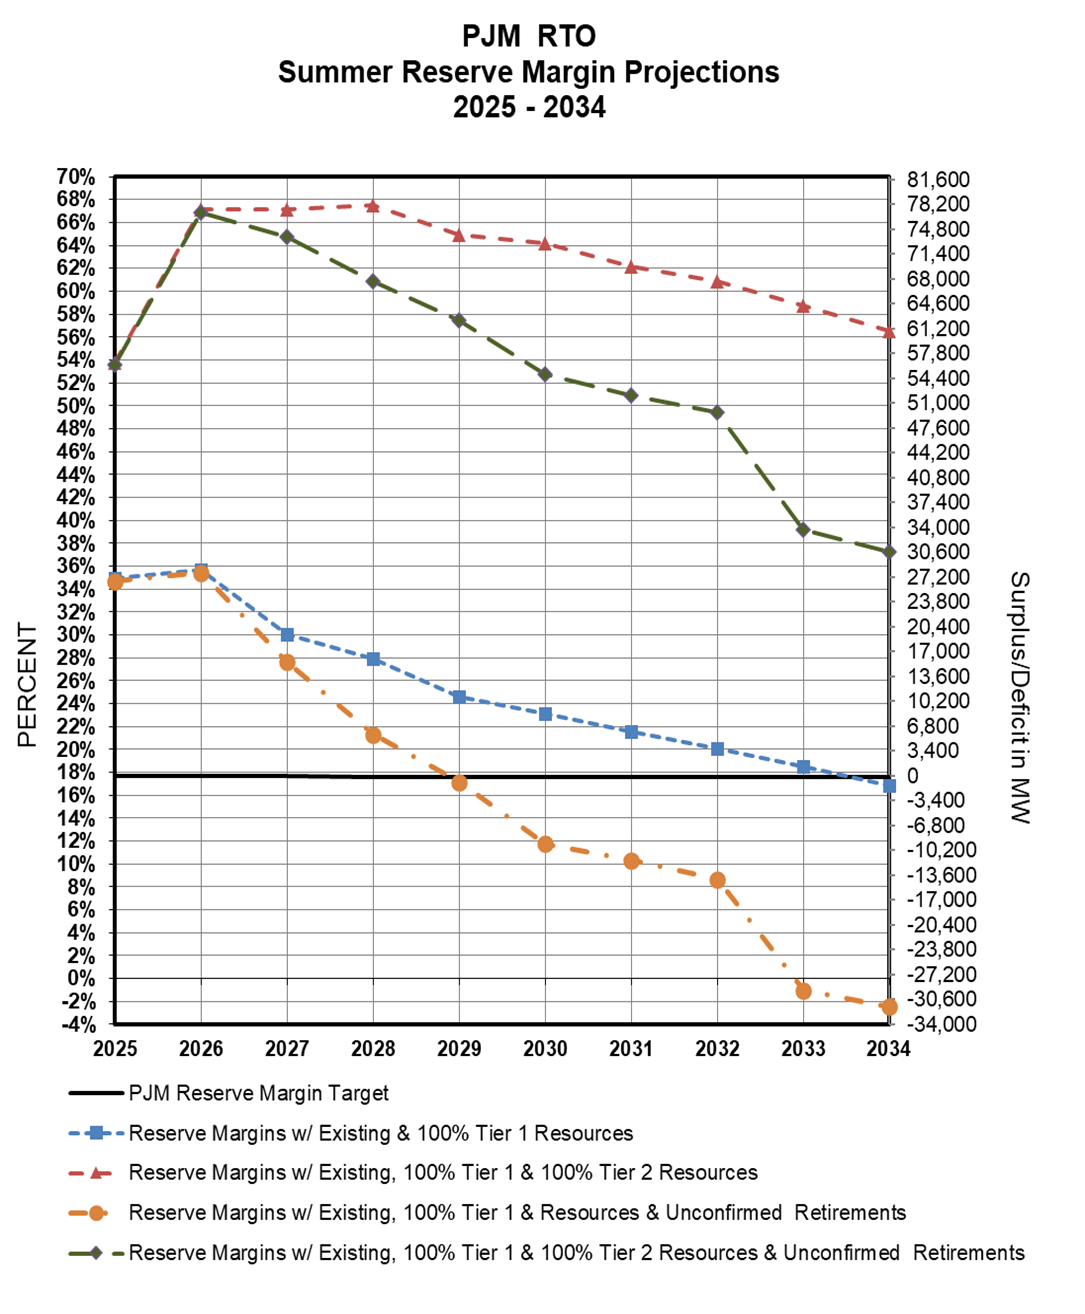
RF also examined several other scenarios, such as projections including additional planned generation resources that could be coming online as well as ones showing unconfirmed generation retirements. The charts below show some of the different projected scenarios for each region, marked by a corresponding colored trendline, with the black line showing the reserve margin target. The summer period is considered for this analysis in order to plan for the period of typical highest load demand on the system within both MISO and PJM.
MISO
MISO resources are projected to be 134,301 MW in 2025 and then increase to 147,187 MW by the end of 2034. This resource calculation includes planned generation retirements, planned generation additions and changes, and Tier 2 and Tier 3 projects from the generation interconnection queue.¹
The retirement of MISO’s coal fleet has continued, with a reduction in capacity of around 6 GW in the past year, and a projected reduction of a further 12 GW over the next five years. Solar continues to rise in capacity contributions, with a growth of 1.2 GW since the 2023 LTRA, and growth of 3.2 GW in the first year of the study.
There are roughly 56 GW nameplate capacity of generation (predominantly solar and battery) with signed generation interconnection agreements in MISO that are projected to come online over the next few years. There have been some delays in the commercial operation of these resources due to the COVID-19 pandemic, supply chain issues and tariffs.
The chart shows the reserve margin for MISO from 2025 through 2034. Please note that varying resource scenarios are used to gauge how much of the generation queue (i.e. generation that is yet to be built) is needed to stay above the target reserve margin. MISO’s anticipated reserve margin, which includes both Existing-Certain and Tier 1 resources, is projected to not satisfy the target reserve margin for years 2025 (1,300 MW short) and 2026 (1,450 MW short). Starting in 2028, the projected reserve margin is 2,657 MW below the target and continues to decline to below 19,700 MW below the target in 2034. These values are represented by the blue line in the chart.
PJM
PJM resources are projected to be 224,440 MW in 2025 and increase to 263,557 MW by the end of 2034. The resource calculations include planned generation retirements, planned generation additions and changes, and all of the capacity in Tier 2 projects presently listed in the generation interconnection queue.
The chart shows the reserve margin for PJM from 2025 through 2034. Please note that varying resource scenarios are used to gauge how much of the generation queue (i.e., generation that is yet to be built) is needed to stay above the target reserve margin. The blue line represents PJM’s reserve margin with both Existing-Certain and all Tier 1 resources. On average, PJM has a 26% reserve margin and is expected to meet its target reserve margin (of approximately 18%) from 2025 through 2033. The blue line drops below its reserve margin target in 2034. This finding is in the last year of the assessment and should be monitored going forward.
The orange line represents PJM’s reserve margin with Existing-Certain and Tier 1 resources plus Unconfirmed Retirements. In this scenario, the orange line drops below PJM’s reserve margin target in 2029 and continues to be below the target for the next five years. This analysis indicates that if Unconfirmed Retirements are realized in PJM, then additional Tier 2 resources need to materialize to meet the reserve margin target.
Grid transformation creates challenges
The transformation of the electric grid adds challenging complexity to these projections. Due to the emergence of large data center loads, year-to-year growth in electricity demand (i.e. load on the system) is becoming less predictable and harder to forecast than it has been historically. At the same time, both MISO and PJM are navigating a changing generation mix, that includes retirements of various coal-fired power plants which are being replaced primarily by intermittent resources such as wind and solar.
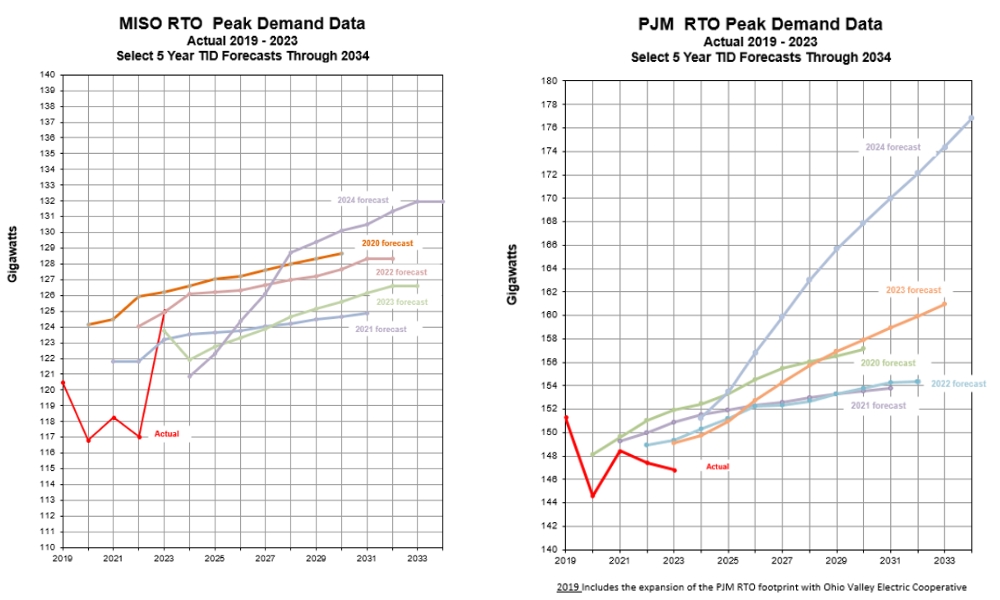
The red line on the left-side chart below displays actual peak demand data over the past five years within MISO. The other colored lines show how RF’s LTRAs in each of the past few years have projected higher and higher levels of peak demand in their respective 10-year forecasts for the region.
The right-side chart below shows how PJM compares in this respect. The large increase in demand growth in the PJM footprint is mainly due to new data centers.
ReliabilityFirst is actively monitoring the rapid demand growth in each region and the risk impact to the Bulk Power System.

Footnotes
1. Frequently used terms:
Existing-Certain: Includes operable capacity expected to be available to serve load during the peak hour with firm transmission.
Tier 1: Includes capacity that is either under construction or has met the required milestones.
Tier 2: Includes capacity that has been requested but has not met some required milestones or executed certain agreements.
Tier 3: Other planned capacity that does not meet the requirements of Tier 1 and Tier 2.
Confirmed Retirements: Capacity with formalized and approved plans to retire. Please note that generator retirements are evaluated on a case-by-case basis by PJM or MISO for potential reliability impacts. If it is determined that reliability impacts exist, the Generation Owner is requested to defer retirement until the reliability impacts are addressed. In this assessment, all confirmed generator retirements are assumed to occur after any reliability concerns are addressed.
Unconfirmed Retirements: Capacity that is considered likely to retire by resource owners, but the formal notification has not been submitted to the respective party. Also included are units for which such notice has been made, but a reliability impact assessment or mitigation is pending.
Recognizing that many projects for new generation withdraw from the interconnection process before completion, PJM and MISO applies a factor to the Tier 2 and Tier 3 resource capacities based on the study phase and likelihood of resources coming online. The effect of using these factors is to reduce the capacity of prospective new resources for more accuracy in long-term planning by accounting for the uncertainty and delays of new resources completing the interconnection process.


